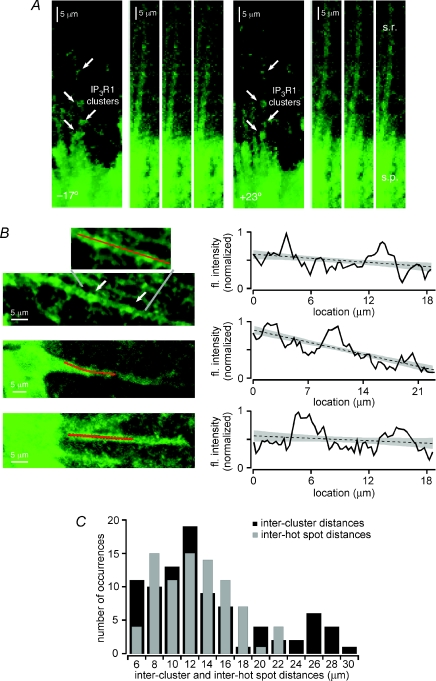
Figure 8. IP3R1s are distributed in clusters along the primary apical dendrites of CA1 hippocampal pyramidal neurons.
A and B, the distribution of IP3R1s in CA1 pyramidal neurons was examined using immunohistochemistry. A, digital confocal images of IP3R1 immunofluorescence were recorded at 0.4 μm intervals from six rats. Projections at −17 deg and +23 deg were made from image stacks depicting IP3R1 immunoreactivity along a single apical dendrite in stratum radiatum of hippocampal area CA1. Four clusters of immunofluorescence, indicated with arrows, are evident along this dendrite. Individual images in different focal planes of the same primary apical dendrite show the same four clusters of immunofluorescence along its length. B, left, images of three different primary apical dendrites exhibiting clusters of IP3R1 immunoreactivity. Red lines indicate sections of dendrite evaluated for immunofluorescence intensity. Right, plots of fluorescence intensity along the analysis lines of the three primary apical dendrites depicted at left. Linear fits to the fluorescence intensity data are indicated with dashed lines, while grey shading denotes 95% confidence bands. Fluorescence intensity rises above the upper 95% confidence band at two or three locations along each section of dendrite. These locations coincide with visible clusters of IP3R1 immunoreactivity in the images at left. C, plot of the distribution of distances between the edges of 89 pairs of adjacent IP3R1 clusters from 36 apical dendrites (black bars) and the distribution of distances between the centres of 82 pairs of adjacent hot spots from 62 cells (grey bars). There is no significant difference between the two distributions (P= 0.218, unpaired t test).

