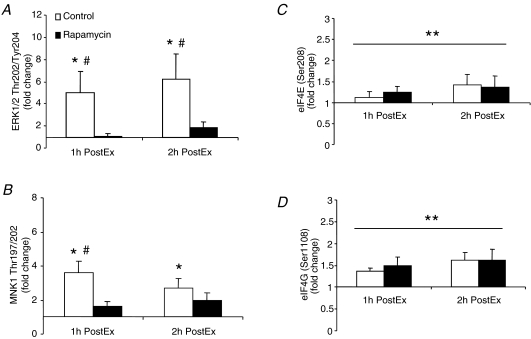
Figure 6. Data represent phosphorylation of ERK1/2 at Thr202/Tyr204 (A, control: n= 8; rapamycin: n= 7), MNK1 at Thr197/202 (B, control: n= 8; rapamycin: n= 7), eIF4E at Ser208 (C, control: n= 5; rapamycin: n= 6) and eIF4G at Ser1108 (D, control: n= 4; rapamycin: n= 7) in control and rapamycin skeletal muscle at basal, 1 h PostEx and 2 h PostEx.
Data are expressed as fold change from basal (mean ±s.e.m.). *Significantly different from basal (P < 0.05). #Significantly different from rapamycin group (P < 0.05). **Main effect for time (P < 0.05).

