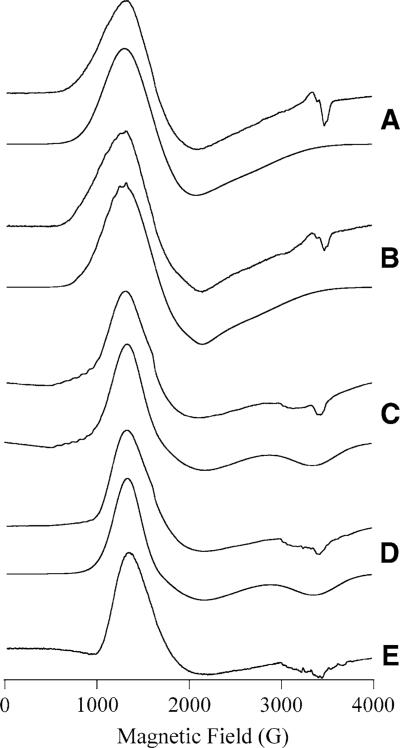
Fig. 4.
EPR spectra of MetAP species containing Co(II). In A–D, the upper spectrum is the experimental spectrum and the lower spectrum is a computer simulation: [CoCo(EcMetAP-I)] + A-311263 (A); [CoCo(EcMetAP-I)] + A-310840 (B); [CoCo(PfMetAP-II)] + A-311263 (C); [CoCo(PfMetAP-II)] + A-310840 (D). Trace E is of naked [CoCo(PfMetAP-II)]]. Experimental spectra were recorded at 7 K, 0.2 mW (A–C); 9 K, 0.2 mW (D), and 5 K, 0.2 mW (E). Spin Hamiltonian parameters for the simulations are given in Table 2

