Fig. 5.
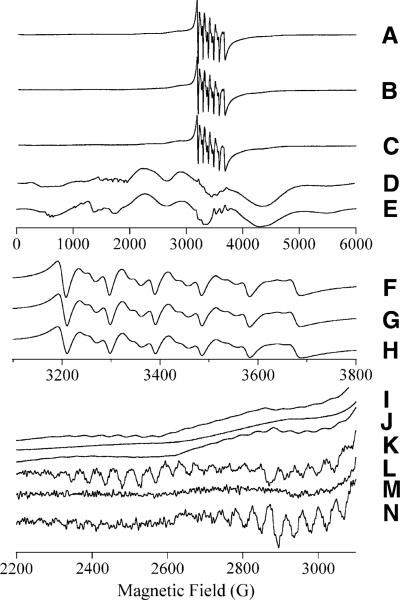
EPR spectra from MetAP containing Mn(II). Traces A–E are 6,000-G (600-mT) experimental scans. Traces F, G, and H and I, J, and K are expanded views of selected regions of A, B, and C, respectively. Traces L, M, and N are derivatives of traces I, J, and K, respectively. The traces correspond to [MnMn(EcMetAP-I)] + A-310840 (A, F, I, L), [MnMn(EcMetAP-I)] + A-311263 (B, G, J, M), [MnMn(Pf(MetAP-II)] + A-310480 (C, H, K, N), and [MnMn (Pf(MetAP-II)] + A-311263 (D). Trace E is a computer simulation of trace D assuming S = 5/2, g = 2.0, AI = 5/2 8.8 × 10⁻³ cm−1, D = 86 × 10−3 cm−1, σD = 7 × 10⁻³ cm−1, E/D = 0, and σE/D = 0.14. Experimental spectra were recorded at 30 K, 0.2 mW (A–C, F–H, I–K) or at 40 K, 0.2 mW (D)

