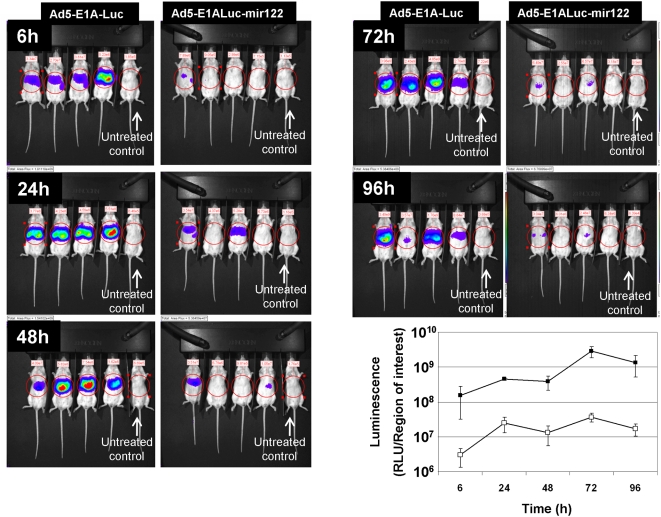
Figure 5. Luciferase transgene expression following intravenous administration of reporter viruses to mice in vivo.
Groups of four mice were administered intravenously 5×10¹⁰ virus particles of Ad5-E1A-Luc (left hand group of each pair of images) or Ad5-E1A-Luc-mir122 (right hand group of each pair) and luminescence was quantified using an Ivis100 imaging system after 6 h–96 h. The mouse on the right of all images is an untreated control, mock injected with luciferin for background levels. Images within pairs can be directly compared, although the scaling is different between time points (see scale bars for details). The graph summarises the expression profile as a function of time.

