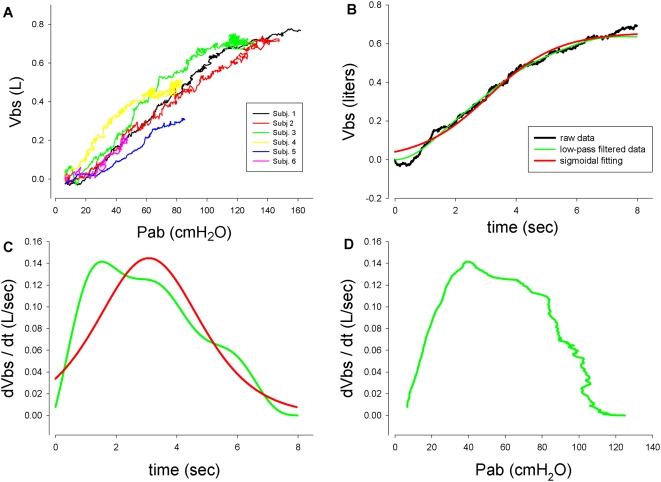
Figure 2. Pressure, volume and flow relationships.
2-A. Volume of blood shifts during ramp increases in Pab in all subjects. Each colour represents a single subject. 2-B. A representative tracing of Vbs during a ramp maneuver as a function of time showing a typical sigmoid shape. The red line superimposed on the raw data results from low-pass filtering and the green line from curve fitting with a sigmoid. 2-C. Flow from the splanchnic bed (dVbs/dt) obtained by differentiating the green and red lines. Both curves indicate that flow increases, reaches a maximum and then decreases nearly to zero. 2-D. The Pab-flow curve shows an initially rapidly increasing flow, a maximum and then a decrease as Pab increases, falling to zero at high Pab. This is explained by the mechanics of fluid flow in a collapsible tube described in the text.

