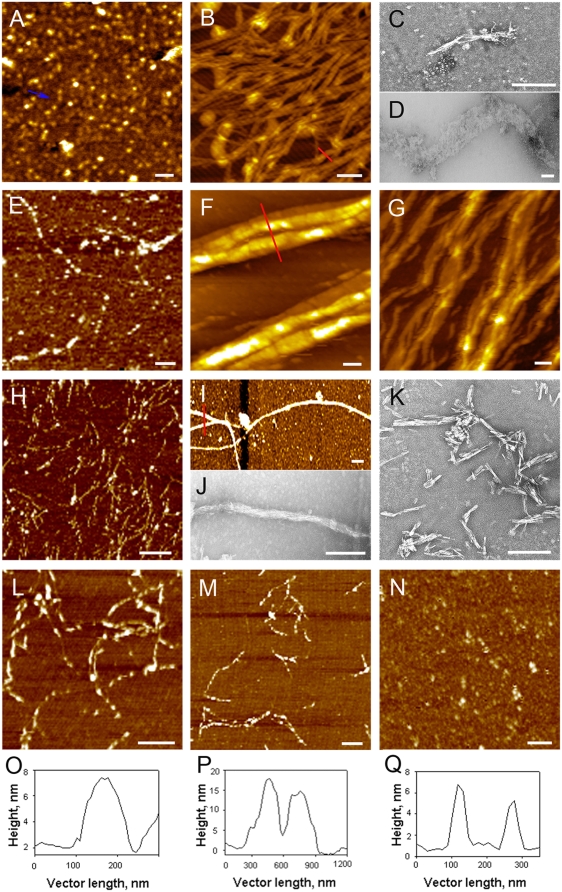
Figure 2. AFM and TEM imaging of ex vivo and in vitro S100A8/A9 amyloid structures.
(A) AFM images of ex vivo amyloid oligomers, chain-like sequences are indicated by blue arrow; (B) ex vivo amyloid fibrillar network; (C,D) TEM images of ex vivo amyloid superstructures; (E) AFM images of S100A8/A9 oligomeric assemblies produced at pH 7.4, 37°C with agitation after 2 week of incubation, (F,G) fibrillar bundles produced at pH 7.4, 37°C with agitation after 8 weeks; (H–K) heterogeneous types of S100A8/A9 amyloids produced at pH 2.0 and 57°C after 4 weeks of incubation with residual content of Ca and Zn. S100A8/A9 amyloids produced at pH 2.0 and 57°C after 2 weeks of incubation in the presence of (L) 1 mg/ml powdered Ca3(PO4)2 and (M) 10 mM ZnCl2; (N) aggregates observed in the presence of 50 mM EDTA. AFM cross-section analysis of amyloid structures indicated by red lines in corresponding images (O from B; P from F and Q from I). Scale bars are shown in white and equal to 250 nm in all AFM images.

