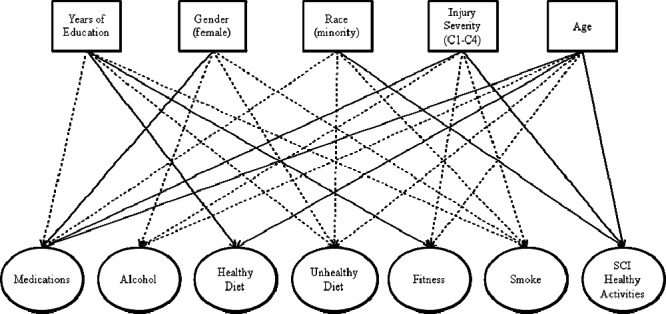
Figure 1. Graphic depiction of the full latent path model, including the items with the factors and the relationship between the biographic, injury, and educational factors with each of the observed factors. Note: Only correlations significant at P < 0.001 are shown. A solid line indicates a positive correlation, and a dashed line indicates a negative correlation.

