
Figure 3.

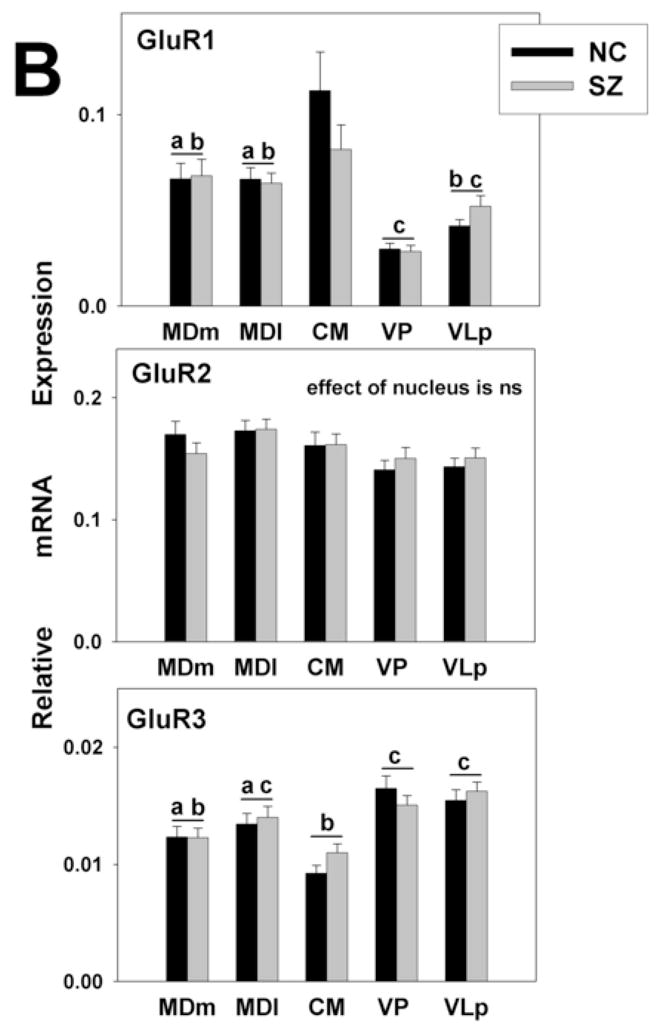

Gene expression analysis by thalamic nucleus and diagnosis. mRNA expression is shown for (A) NMDA (B) AMPA, and (C) kainate receptor subunits. The expression levels for all glutamate receptor subunits detected varied significantly across nuclei. There were no differences between the diagnoses. Histograms represent means and SEMs. For each gene, histograms that do not share the same symbol (a,b,or c) represent means that differ statistically (p<0.005) after Bonferroni correction. ns, not significant.