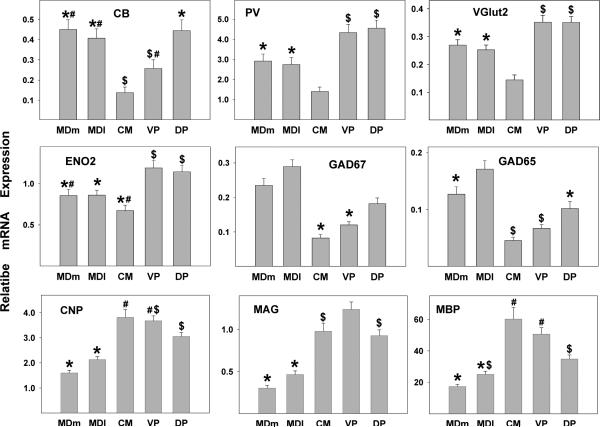
Figure 2. Gene expression analysis by thalamic region.
The expression levels for both the neuronal and the oligodendrocyte genes varied significantly across regions. Histograms represent means and SEMs. For each gene, histograms that do not share the same symbol represent means that differ statistically (p<.005) after Bonferroni correction. With thalamic region as a repeated measure, there was a significant main effect of region for each gene (p<.00001, each test) examined but no diagnosis by region interactions.

