Figure 3.
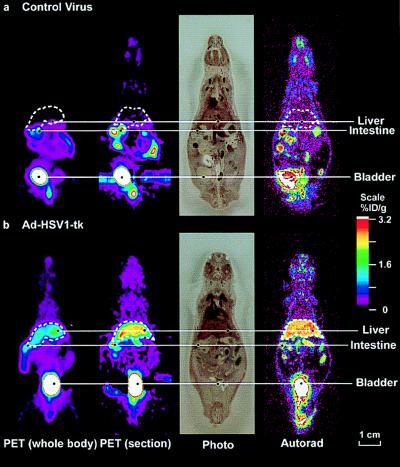
MicroPET and DWBA images of mice after AdCMV-HSV1-tk and control virus administration. Swiss–Webster mice were injected via the tail vein with 1.5 × 10⁹ pfu of control virus (a) or 1.5 × 10⁹ pfu of AdCMV-HSV1-tk virus (b). For each mouse, a whole-body mean coronal projection image of the fluorine-18 activity distribution is displayed on the left. The liver outline, in white, was determined from both the FGCV signal and cryostat slices. The second images from the left are coronal sections, approximately 2-mm thick, from the microPET. After their PET scans, the mice were killed, frozen, and sectioned. The next images are photographs of the tissue sections (45-μm thickness) corresponding to approximately the midthickness of the microPET coronal section. The images on the right are DWBA of these tissue sections. The color scale represents the FGCV %ID/g. Images are displayed on the same quantitative color scale to allow signal intensity comparisons among them.

