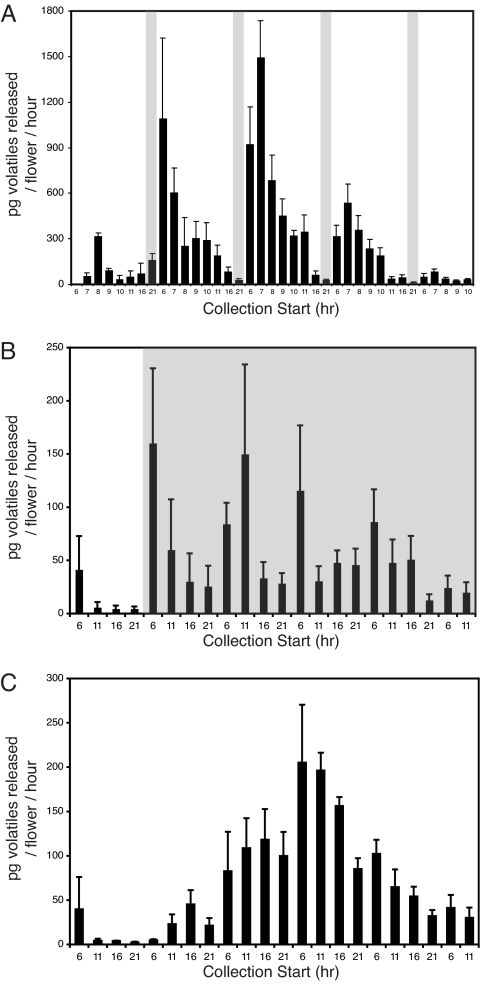
Fig. 2.
Time course of volatile emissions from grapevine flowers at bloom. Data represent the amounts of volatiles detected by GCMS. Gray bars illustrate the period of darkness for each experiment. (A) Time course of volatile emissions divided into hourly segments between 0600 and 1100 hours. Bars represent 2–6 replicates + SEM. (B) Volatile emissions during constant darkness after the first day of blooming. Bars represent 5 replicates + SEM. (C) Volatile emissions during constant light conditions. Bars represent 3 replicates + SEM.

