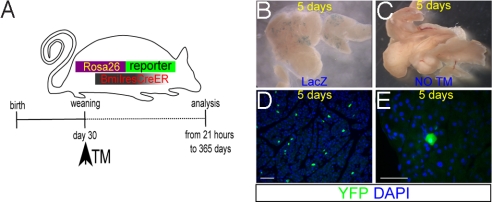
Fig. 1.
Bmi1 lineage analysis in pancreas. (A) More than 70 Bmi1Cre-ER/+;Rosa26YFP/+ mice (or Rosa26LacZ/+) were generated, injected at weaning with TM, and harvested at different time points from 21 h up to 1 year. (B) Whole-mount LacZ staining showing the pattern of the lineage obtained 5 days after TM treatment. (C) Age-matched control Bmi1Cre-ER/+;Rosa26LacZ/+ pancreas without TM showed no activation of the LacZ reporter. (D and E) Pancreatic sections showing the Bmi1+ lineage. (E) High magnification of an YFP+ differentiated acinar cell. (Scale bars: 50 μm.)

