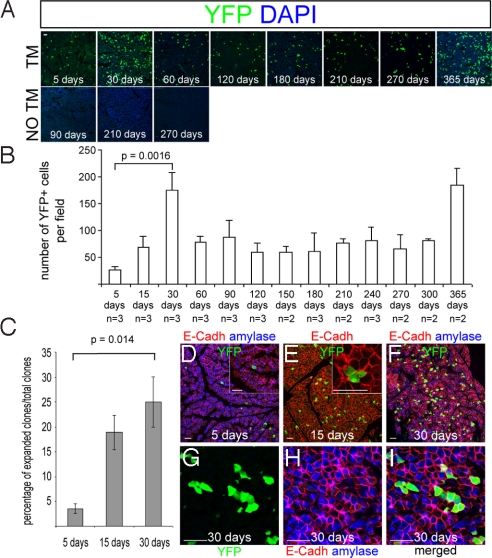
Fig. 3.
Bmi1 long-term lineage analysis. (A and B) Bmi1Cre-ER/+;Rosa26YFP/+ mice were injected at weaning with TM and followed for >1 year. (A) Representative microscopic fields of pancreas harvested at different time points showing YFP+ cells. Control pancreas with the same genotype without TM, showing no YFP+ cells. (B) Graph showing the number of YFP+ cells present at the different time points analyzed. (C) Graph showing the percentage of clones at 5, 15, and 30 days that underwent replication. YFP+ cells with 1 or more labeled adjacent cells (expanded clones) increased over time. (D–I) Representative pictures of mostly isolated cells at 5 days (D) and expanded clones at 15 and 30 days (E–I). (Insets) High-magnification images of an isolated cell (D) and 3 YFP+ adjacent cells (E). (Scale bars: 50 μm.)

