Fig. 4.
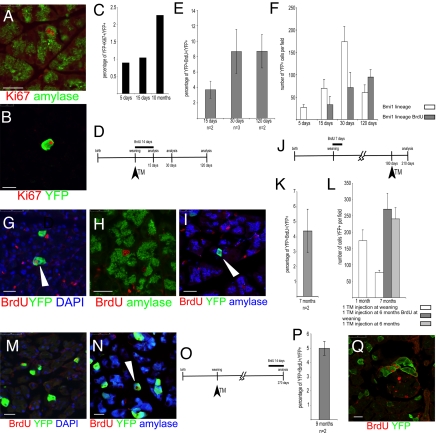
Proliferation analysis of the Bmi1 lineage. (A) Amylase+ cells are Ki-67+ indicating proliferation potential. (B and C) Bmi1 lineage is also Ki-67+. (D–I) Short-term analysis of BrdU incorporation. (D) Schematic representation of the BrdU and the TM treatment. (E) Percentage of YFP+BrdU+ cells at 15, 30, and 120 days. (F) The Bmi1+ lineage in mice fed with BrdU was reduced, with respect to mice never treated with BrdU, at 15 and 30 days, but was comparable at 120 days. (G–I) Representative microscopic fields showing YFP+BrdU+ (white arrowhead), amylase+BrdU+, and amylase+YFP+BrdU+ cells (white arrowhead). (J–N) Long-term BrdU chase to show the persistence of the BrdU lineage. (J) Schematic representation of the whole experiment. (K) Percentage of YFP+BrdU+ cells at 7 months. (L) Comparison of the lineage at 1 and 7 months after 1 TM injection at weaning and at 7 months after 1 injection at 6 months (with and without BrdU). (M and N) Representative pictures of YFP+BrdU+ and amylase+YFP+BrdU+(white arrowhead) cells indicating that those cells were differentiated. (O–Q) BrdU treatment at 8 months after TM treatment. (O) Schematic representation of the TM and BrdU treatments. (P) Percentage of YFP+BrdU+ cells at 9 months. (Q) Representative pancreatic section showing 4 YFP+BrdU+ cells. (Scale bars: 25 μm.)

