Fig. 6.
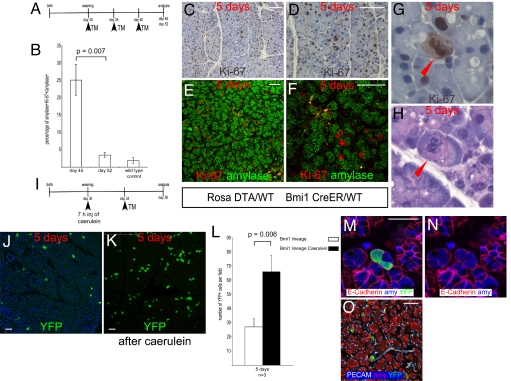
Bmi1 lineage ablation. (A) Bmi1Cre-ER/+;Rosa26DTA/+ mice were injected 3 times every 5 days before harvesting pancreas 5 and 12 days after last injection. (B) After 5 days there were many cells in mitosis. Amylase+Ki-67+ cells were counted, compared at 5 and 12 days after injection, and compared with wild-type age-matched control pancreas. (C–H) Representative pictures at low and high magnification showing Ki-67+ cells actively dividing. E and F are low and high magnification, respectively, of amylase+Ki-67+ cells. It was common to observe chromosomes in metaphase (G and H)(red arrowheads). (I–L) Bmi1 lineage after mild pancreatitis. (I) Schematic diagram showing the caerulein treatment followed by TM administration in Bmi1Cre-ER/+;Rosa26YFP/+ mice. (J–L) The Bmi1 lineage was increased compared with the lineage without caerulein treatment. (J and K) Representative pictures at 5 days after TM without and with caerulein. (M–O) Representative pictures showing that after caerulein treatment the Bmi1 lineage is present only in differentiated cells. (Scale bars: 50 μm.)

