Fig. 3.
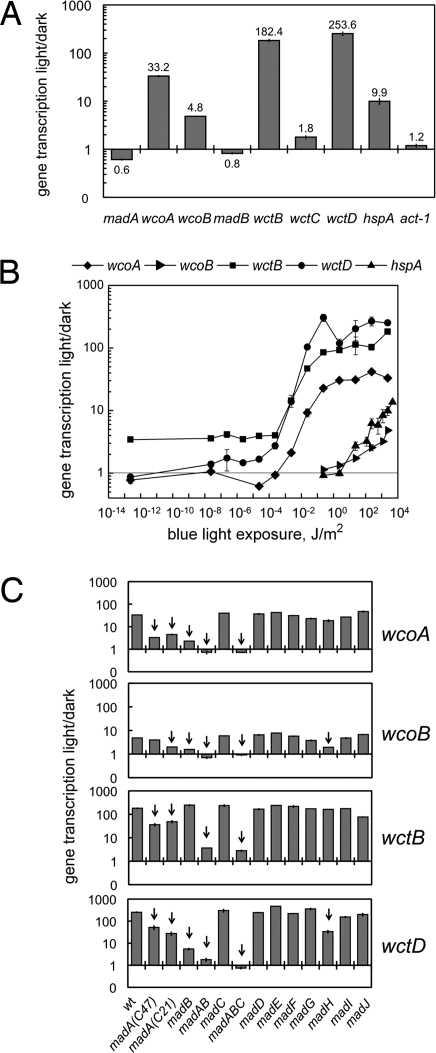
Regulation of gene transcription by blue light. Total RNAs were isolated from mycelia exposed to blue light, or kept in the dark. The amount of mRNA for each gene was assayed by quantitative RT-PCR. Each fluorescent signal was first normalized to the corresponding actin signal to correct for loading errors and then was normalized to the signal obtained in the dark. The plots show the relative photoactivation in 2–15 independent experiments (average ± SEM). (A) Photoactivation of gene expression in the wild type after 30 min of blue light (2.3 × 10³ J/m2). (B) Threshold determination for the photoactivation of gene expression in the wild type. Mycelia were exposed to blue light of different intensities during 30 min before mRNA extraction. 1 J/m2 of blue light corresponds to 4 μmol/m2 of 450 nm. (C) Photoactivation of gene expression in the wild type and mad mutants after 30 min of blue light (2.3 × 10³ J/m2). The madA madB double mutant is shown as madAB, and the madA madB madC triple mutant is shown as madABC. For strain numbers see SI Text.

