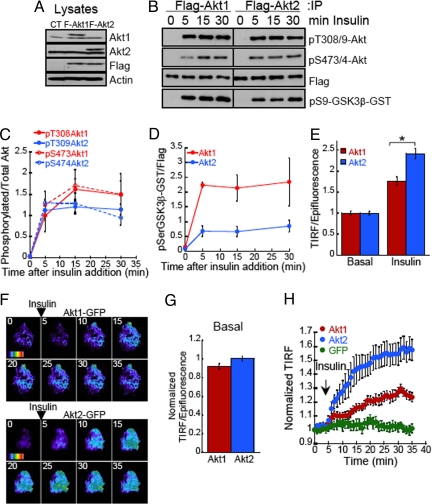
Fig. 1.
Insulin differentially regulates the plasma membrane accumulation of Akt isoforms in adipocytes. (A) Immunoblot analyses of cell extracts from adipocytes stably expressing Flag-Akt1 or Flag-Akt2. (B) Immunoblot analyses of the phosphorylation pattern and in vitro activity of immunoprecipitated Flag-Akt1 or Flag-Akt2 after 10 nM insulin stimulation. In vitro activity kinase assay was performed using as substrate a GST-GSK3β fusion peptide. (C) Densitometric analyses of insulin-induced Flag-Akt1 and Flag-Akt2 phosphorylation at Thr308/9 and Ser473/4. Each data point represents the mean ± SE, n = 3–4. (D) Densitometric analyses of in vitro Akt activity measurements. Each data point represents the mean ± SE, n = 3–4. (E) Quantification of insulin-induced Flag-Akt1 and Flag-Akt2 redistribution to the PM using TIRF microscopy. Indirect immunofluorescence of the Flag epitope in basal or insulin-stimulated cells was measured in the epifluorescence mode and in the TIRF mode. The TIRF is normalized to the anti-Flag fluorescence in the epifluorescence mode. For each experiment the data are normalized to the basal state of Flag-Akt1 expressing cells. Each data point represents the mean ± SE, n ≥ 80 cells. *, P < 0.001 (t test). (F) Time-lapse TIRF microscopy of Akt1-GFP and Akt2-GFP. Images were acquired every min for 35 min, 10 nM insulin was added after 4 min of recording. The average GFP intensity for each cell in the first frame has been subtracted and the pseudo colored images have been equally scaled to allow direct comparison of insulin-induced changes in TIRF for the different constructs. Pseudo color is from purple (low signal) to red (highest signal). (G) Quantification Akt1-GFP and Akt2-GFP TIRF versus epifluorescence in live adipocytes in basal conditions. The data are normalized to the Akt2-GFP TIRF/Epifluorescence ratio. Each data point represents the mean ± SE, n ≥ 120 cells. (H) Quantification of time-lapse TIRF microscopy of GFP, Akt1-GFP, and Akt2-GFP. TIR GFP fluorescence for each cell was measured in every frame, background fluorescence was subtracted and fluorescence was normalized to the first frame TIRF value. The data shown are the mean ± SE, n ≥ 12 cells.

