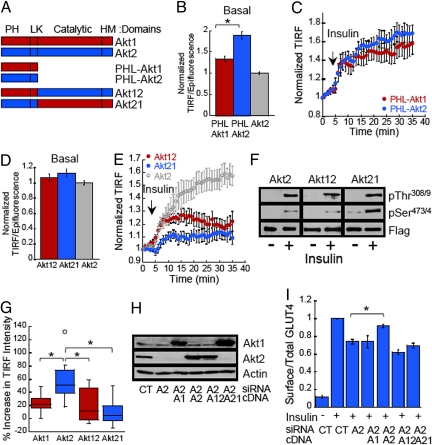
Fig. 2.
Insulin-induced accumulation of Akt2 at the PM depends on both the PH-linker and catalytic-regulatory domains and necessary for GLUT4 translocation. (A) Schematic representation of Akt constructs tagged with eGFP at the carboxy-terminus. Akt1: full length Akt1; Akt2: full length Akt2; PHL-Akt1: Akt1 residues 1–149; PHL-Akt2 residues 1–151 Akt2; Akt12: chimera Akt1 (1–149)-Akt2 (152–481); Akt21: chimera Akt2 (1–151)-Akt1 (150–480). (B) Quantification PHL-Akt1-GFP and PHL-Akt2-GFP TIRF versus epifluorescence in live adipocytes in basal conditions. The data are normalized to the Akt2-GFP TIRF/Epifluorescence ratio. Each data point represents the mean ± SE, n ≥ 76 cells. *, P < 0.01 t test. (C) Quantification of time-lapse TIRF microscopy of PHL-Akt1-GFP and PHL-Akt2-GFP. Data are process as in Fig. 1H. The data shown are the mean ± SE from n ≥ 13 cells per condition. (D) Quantification of Akt12-GFP and Akt21-GFP TIRF versus epifluorescence in living adipocytes in basal conditions. The data are normalized to Akt2-GFP TIRF/Epifluorescence ratio. Each data point represents mean ± SE, n ≥ 77 cells. (E) Quantification of time-lapse TIRF microscopy of Akt12-GFP and Akt21-GFP. Data quantified as described in Fig. 1H. Quantification of time-lapse TIRF of Akt2-GFP from Fig. 1H has been included for direct comparison. The data shown are the mean ± SE, n = 12 cells. (F) Immunoblot analyses prepared from 3T3-L1 adipocytes stably expressing Flag-Akt2, Flag-Akt12 or Flag-Akt21. Adipocytes were treated with 10 nM insulin and Akt constructs were immunoprecipitated with an anti-Flag epitope antibody. (G) Box-and-whisker diagram showing the increase in TIR fluorescence of GFP tagged Akt constructs in adipocytes after 30 min of insulin stimulation. Data are derived from graphs in Figs. 1H and 2E. *, P < 0.001 (ANOVA). (H) Immunoblot analyses of cell extracts prepared from adipocytes coelectroporated with Akt siRNAs and cDNAs as noted. (I) Surface-to-total distribution of HA-GLUT4-GFP in adipocytes electroporated with control or Akt2 siRNA and cDNA encoding Akt constructs: A1, Akt1; A2, Akt2; A12, Akt12 chimera; A21, Akt21 chimera. Each bar represents the mean ± SE, n = 2–6. In each experiment the surface-to-total GLUT4 distribution was normalized to that of control cells stimulated with 1 nM insulin.

