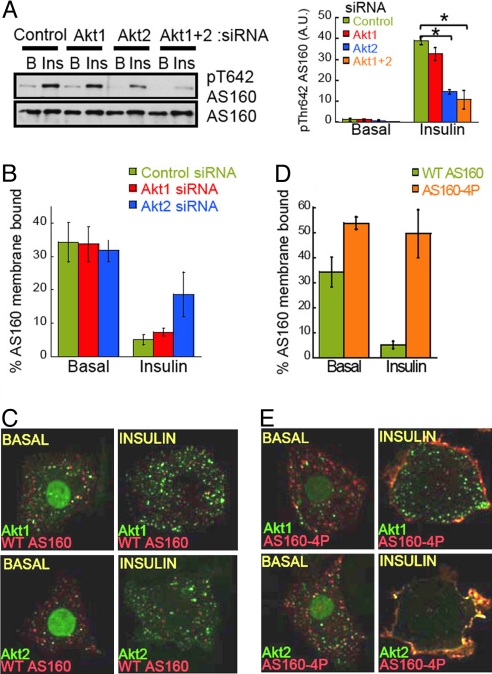
Fig. 4.
Akt2 interacts with AS160 at the PM environment and regulates AS160 phosphorylation and membrane release in response to insulin. (A) Left, immunoblot of AS160 phosphorylation in adipocytes electroporated with noted siRNAs. B, Basal, and Ins, insulin, 10 nM for 15 min. Right, densitometric analyses of AS160 phosphorylation. Each data point represents the mean ± SE, n = 3. *, P < 0.05 (ANOVA). (B) Adipocytes electroporated with Flag-AS160, HA-GLUT4-GFP and siRNAs as noted. Serum-starved or insulin stimulated cells were permeabilized for 1 min to leak out cytosolic contents and the amount of membrane bound AS160 was determined by indirect immunofluorescence as described in Methods. (C) Confocal images of permeabilized adipocytes overexpressing Akt1-GFP or Akt2-GFP and Flag-AS160 in the absence or presence of 10 nM insulin. The Akt-GFP constructs display some nuclear localization, consistent with previous reports; however, it is of note that this nuclear fraction can be dynamically mobilized upon stimulation. (D) Adipocytes were electroporated with Flag-AS160 or Flag-AS160–4P and HA-GLUT4-GFP and membrane bound AS160 was determined as in B. Each bar represents the mean ± SE, n = 3. (E) Confocal images of permeabilized adipocytes overexpressing Akt1-GFP or Akt2-GFP and Flag-AS160–4P in the absence or presence of 10 nM insulin.

