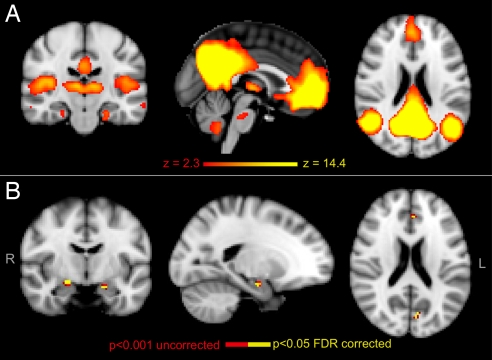
Fig. 1.
Results of analysis of resting fMRI. (A) Spatial map representing the DMN for all 36 subjects. Regions belonging to this network include prefrontal, anterior and posterior cingulate, lateral parietal, and inferior/middle temporal gyri; cerebellar areas; and thalamic nuclei and extending to MTL regions. (B) DMN comparison between the 2 groups revealed increased coactivation in retrosplenial, medial-prefrontal, and MTL (head of the hippocampus and amygdala) regions of the DMN in APOE ε4-carriers relative to noncarriers. Red-to-yellow colors define increases in coactivation. R, right hemisphere; L, left hemisphere.

