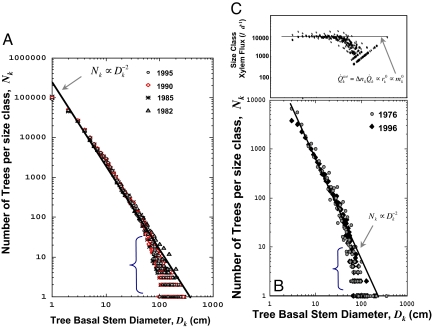
Fig. 1.
Relationship between number of individuals or xylem flux for trees in differing size classes. (A) Size distribution for the 50-ha tropical rain forest on Barro Colorado Island, Panama. Data from surveys in 1982, 1985, 1990, and 1995 are shown. The plotted line has a slope of −2, the value predicted by our model. (B) Size distribution for the ≈16-ha tropical deciduous forest at San Emilio, Guanacaste, Costa Rica. The two forest surveys for 1976 and 1996 are shown. For the 1976 data, the diameter measures were rounded at the time to the nearest 1 cm, which is the likely reason for the observed variation. (C) Approximate invariance of the flux of water through the differing size classes of trees within the San Emilio Forest in 1996. Water flux determined from ref. 15. Note, for both forests, the increasing splay of variation for the largest tree sizes (bracketed regions), which likely reflects sources of mortality in addition to competitive thinning.

