Fig. 3.
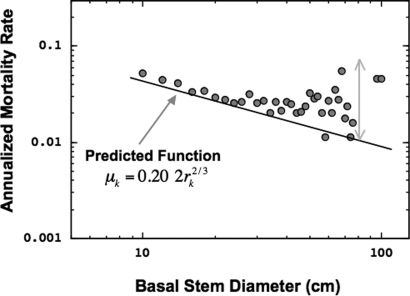
Relationship between tree size (measured as basal stem diameter, Dk, where Dk = 2rk) and annualized mortality rate, μk, for tagged trees in the San Emilio forest. Size classes are binned at 1-cm resolution. The line, μk = Dk−2/3, is the predicted mortality function based on scaling of growth and the allometric relationship between stem diameter and total biomass for individual trees in this forest (see Eqs. 7 and 8, and the SI Text). Whereas the observed data are generally close to the predicted curve, there is increasing variation and deviation for the largest trees, likely because of noncompetitive sources of mortality not included in the model.

