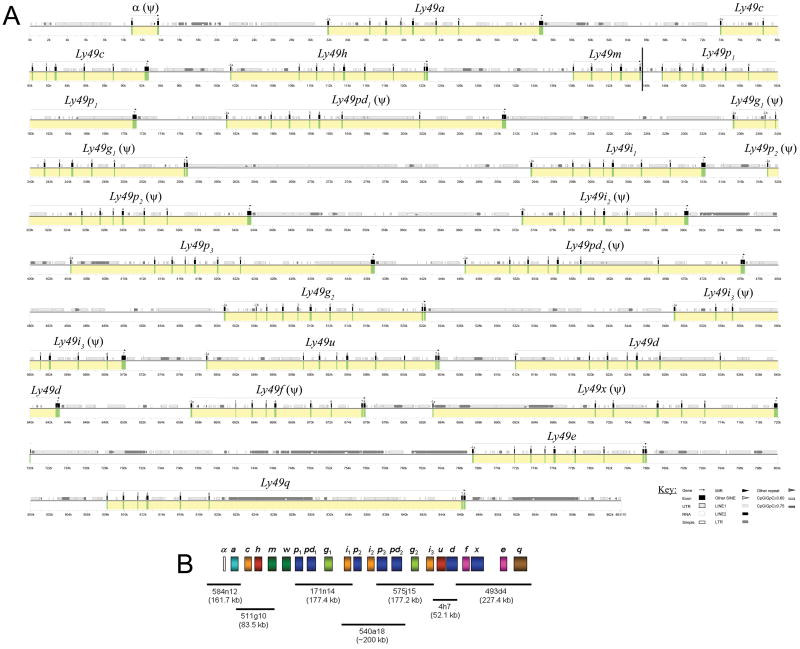
Figure 4.
Organization of the NOD Ly49 gene cluster. (a) A 862 kb sequence of the NOD Ly49 cluster is represented in graphical form using Pipmaker. The sequence is demarcated below the plot in kilobases. Regions that contain genes are marked in yellow and exons in green. The name of the gene is given above the yellow area and predicted pseudogenes are denoted with a (ψ). A vertical bar between the Ly49m and p1 genes indicates the gap believed to contain Ly49w. See key for symbols of different types of repeats and other sequence elements identified using Repeatmasker. (b) An inset (bottom) displaying the location, name, and size of the BACs used for sequencing the cluster.

