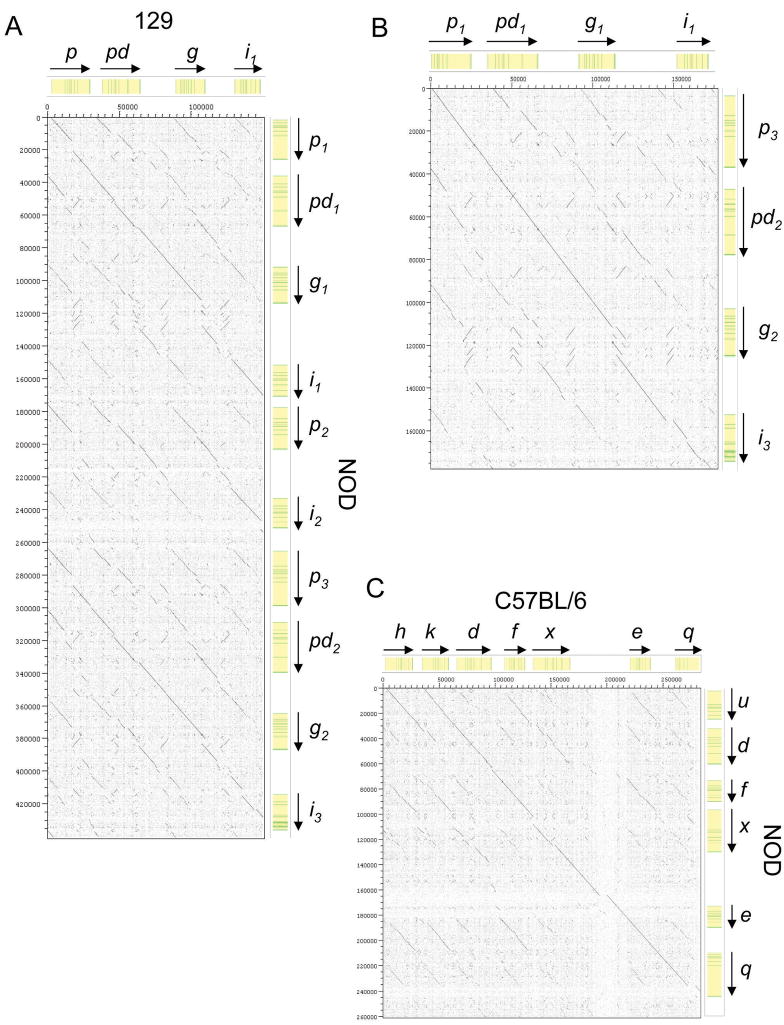
Figure 6.
Direct sequence comparison between the B6, 129S6, and NOD Ly49 gene clusters. Specific regions of B6, 129S1 and NOD Ly49 gene clusters were directly compared at the nucleotide level using the Dotter program. Sequence comparisons are shown for (a) the Ly49p-i regions of 129 vs NOD, (b) the NOD Ly49p1-i1 and Ly49p3-i3 regions, and (c) the centromeric portion of the NOD vs. B6 haplotypes. Diagonal lines represent regions of sequence homology. The location of genes (yellow) and exons (green) is shown above and on the right side of the plot. The scale on both axes is in base pairs. Breaks in continuity of the homology lines indicate the locations of haplotype-specific deletions/insertions such as repetitive elements.

