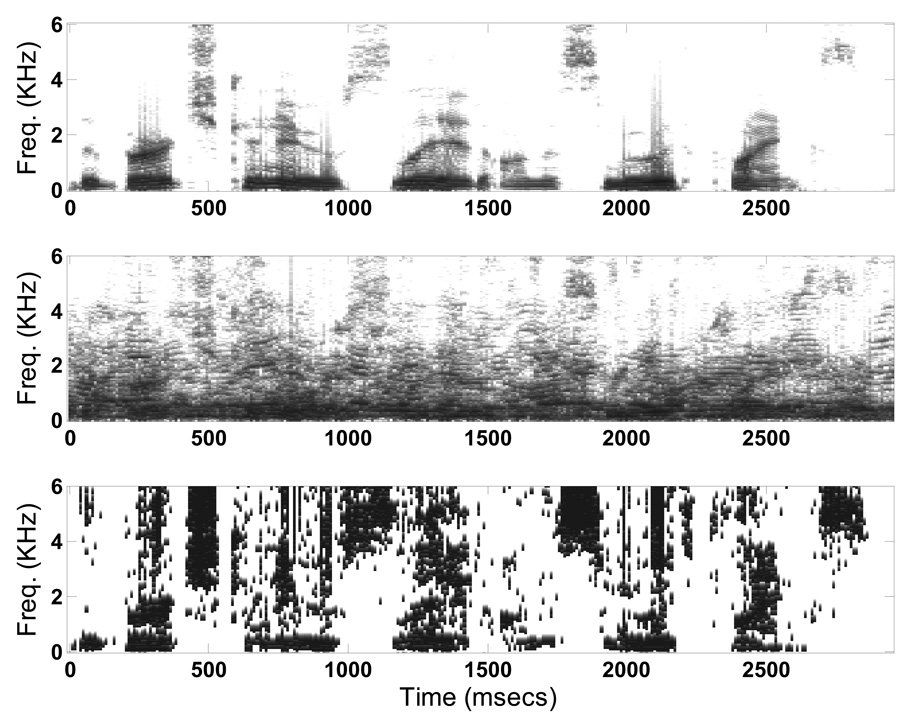
Figure 2.
Top panel shows the spectrogram of a sentence in quiet from the IEEE corpus. Middle panel shows the spectrogram of the sentence embedded in multi-talker babble at −5 dB SNR. Bottom panel shows the ideal binary mask using an SNR threshold of 0 dB, with white pixels indicating a 0 (target weaker than the masker) and black pixels indicating a 1 (target stronger than the masker).

