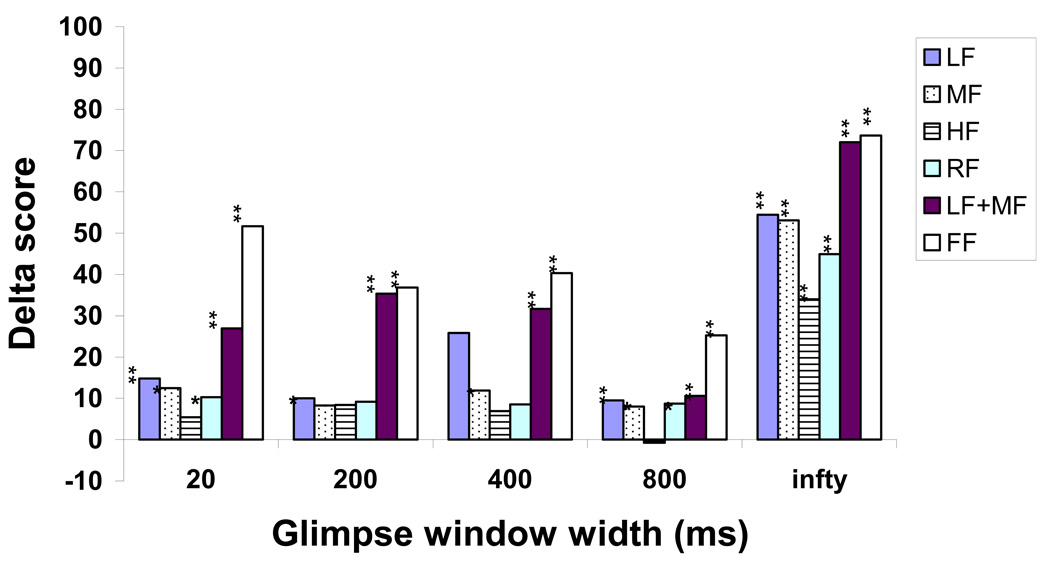
Figure 4.
Difference in performance between that reported in Figure 3 with glimpsed stimuli, and the baseline performance (26.8% correct). Asterisks (* p<0.05, ** p<0.005) indicate statistically significant differences between the performance obtained with glimpsed stimuli and baseline stimuli. The ‘infty’ condition corresponds to the condition in which the indicated frequency bands were glimpsed throughout the whole utterance.

