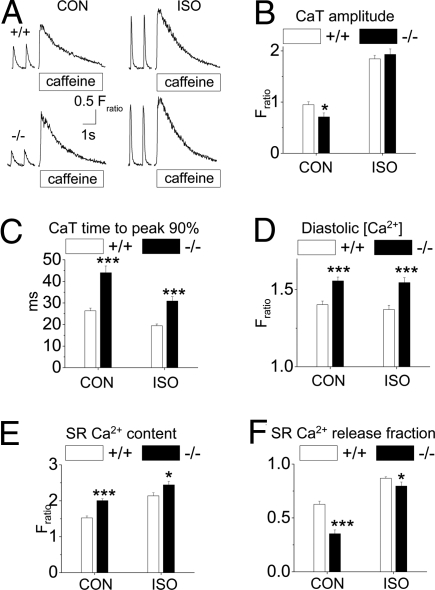
Fig. 4.
Trdn−/− myocytes display impaired SR Ca2+ release despite increased SR Ca2+ content. (A) Representative examples of rapid caffeine (10 mM) application to Trdn+/+ (+/+) and Trdn−/− (−/−) myocytes that were field stimulated at 1 Hz to maintain consistent SR Ca2+ load. The 2 last paced Ca2+ transients (CaT) are also shown. The amplitude of the caffeine transient was used as a measure of total SR Ca2+ content. Experiments were carried out in control conditions (CON) and in the presence of 1 μM ISO. (B–F) Comparisons of average CaT amplitudes (B), CaT rise time (0 to 90% of peak) (C), end-diastolic [Ca2+] (D), SR Ca2+ content (E), and SR Ca2+ release fraction (F) in the 2 groups. Trdn+/+ (+/+): n = 37 (CON) and 31 (ISO); Trdn−/− (−/−): n = 38 (CON) and 23 (ISO); *, P < 0.05; ***, P < 0.001. CaT time to peak 90%, time to reach 90% of peak CaT height.

