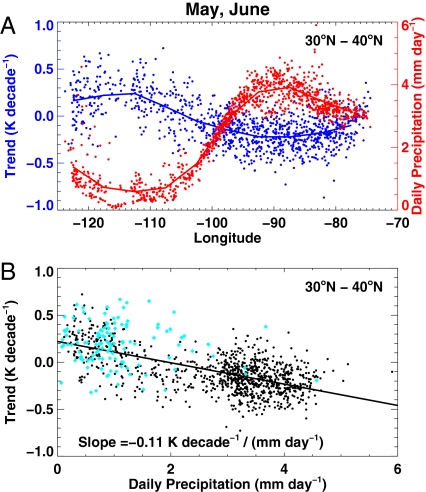
Fig. 3.
1950–2006 May-June daily maximum temperature trends together with March-June average daily precipitation for 30–40°N. (A) Longitudinal variation. Solid lines show the averaged results and the points show individual stations. (B) Scatter plot of the points in A along with a least-squares trend line fitting the data. The points in the region 115–125°W and 30–40°N (primarily California) are highlighted in cyan.

