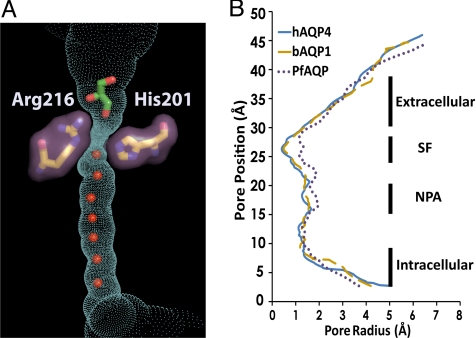
Fig. 2.
The conducting pore. The trace of the pore inner surface is shown in cyan. The selectivity filter residues, Arg-216 and His-201, are shown as sticks with surfaces in purple. The glycerol molecule is shown as green stick, and the water molecules in the channel are shown as red spheres. (B) Plot of the channel radius versus position along the pore for human AQP4, bovine AQP1 (bAQP1), and the P. falciparum AQP (PfAQP). Regions of the channel are labeled as extracellular vestibule, the selectivity filter (SF), the NPA motif, and the intracellular vestibule. The pore inner surface and its dimension are calculated using Hole 2.0 (51).

