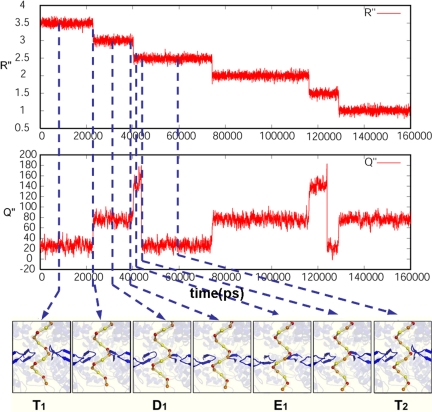
Fig. 5.
The simulated time dependence of the translocation process for a case with a low barrier. The figure displays the time dependence of the R″ and Q″ coordinates and snapshots along the translocation path. The specific simulation is done for a barrier of 4 kcal/mol for the T to D transition. Simulations with higher barriers give similar results (but, of course, with longer translocation times). See also Movie S1.

