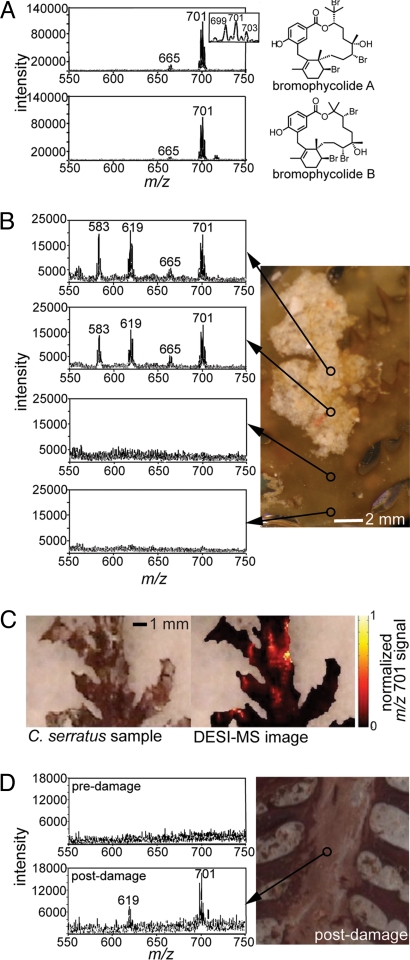
Fig. 2.
Negative-ion desorption electrospray ionization (DESI) mass spectra of bromophycolides (using DESI spray solution of 100 μM NH4Cl in MeOH). (A) Mass spectra of pure bromophycolides A and B deposited on synthetic substrates (10 μL, 1 mg/mL solution). Ion clusters centered around m/z 665 and 701 correspond to [bromophycolide A/B − H]− and [bromophycolide A/B + Cl]−, respectively. (B) Typical DESI mass spectra of C. serratus surface, showing that bromophycolides occur on algal surfaces only in association with light-colored patches (n = 40 sites observed on 6 independent algal samples; DESI beam area 200 μm). Ion clusters centered at 583 and 619 represent [bromophycolide E − H]− and [bromophycolide E + Cl]−, respectively (Fig. S3). (C) DESI-MS image (200-μm resolution) of bromophycolide A/B chloride adduct ion m/z 701 on C. serratus surface, indicating that bromophycolide “hot spots” correspond to pale patches. (D) Representative mass spectrum from patch-free algal surface before and after mechanical damage (n = 2 damaged samples).

