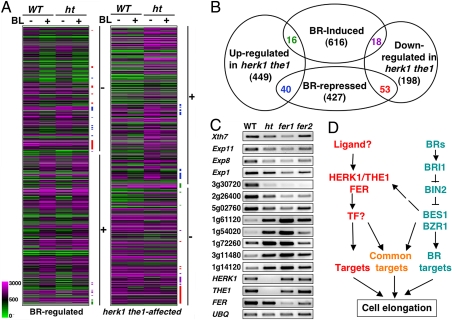
Fig. 4.
HERK1/THE1/FER and BR pathways affect independent genes with some overlap. (A) Cluster analysis of BR-regulated genes in WT and mutant plants. The majority of BL-repressed genes (marked by −) and BL-induced genes (marked by +) are not affected in herk1 the1 double mutant (ht). Likewise, the majority of genes down-regulated (−) or up-regulated (+) in herk1 the1 double mutant are not regulated by BRs. The overlap between BR- and HERK1/THE1-affected genes are indicated by colored bars corresponding to the colored numbers in the overlaps shown in Fig. 4B. (B) A diagram showing the overlap of BR- and HERK1/THE1-regulated genes. Lists of the genes represented in this diagram are presented in Table S1, Table S2, Table S3, and Table S4. (C) Semiquantitative PCR with primers from indicated genes to confirm the microarray data in the herk1 the1 double mutant (ht) and to examine the expression levels in fer1 and fer2 mutants. Genes either down- or up-regulated in the herk1 the1 double mutant and the 3 receptor genes were tested. (D) A model for the BR- and HERK1/THE1-pathways in the regulation of cell elongation. See Discussion for details. TF stands for putative transcription factor.

