
Figure 3.
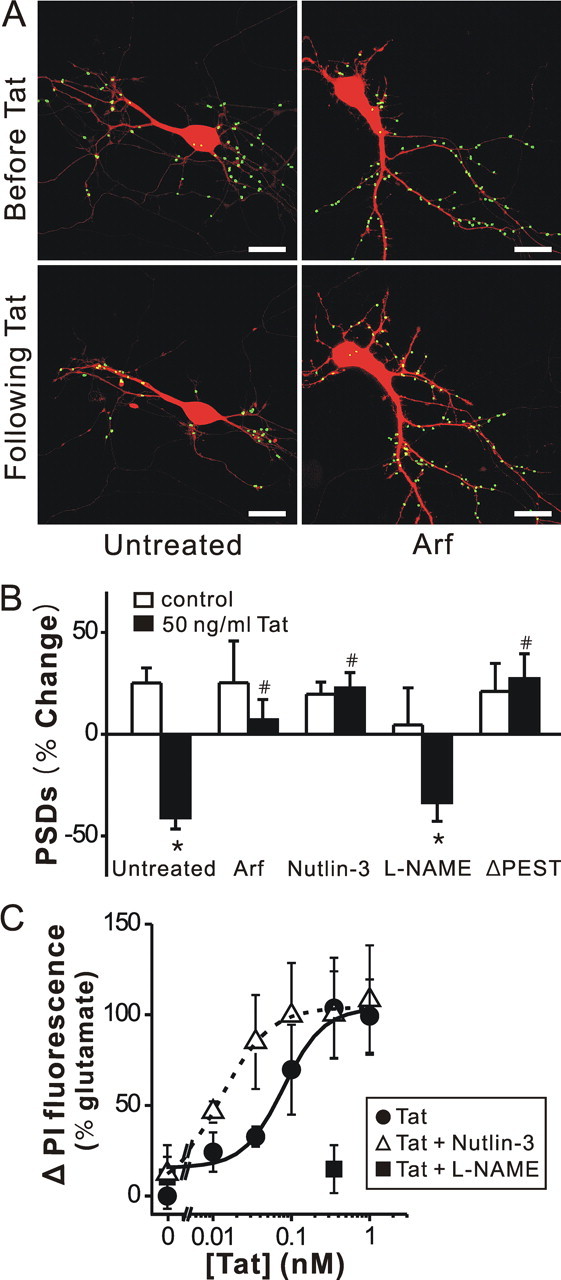
Tat induced PSD loss via the ubiquitin–proteasome pathway, and Tat induced cell death by activating NOS. A, Processed images acquired before and after 24 h treatment with 50 ng/ml Tat in cells coexpressing ARF display labeled PSDs superimposed on DsRed2 fluorescence. Scale bar, 10 μm. B, Bar graph summarizes the effects of inhibition of the ubiquitin–proteasome pathway and inhibition of nNOS on changes in PSD–GFP puncta (PSDs) after 24 h treatment under control (open bars) or 50 ng/ml Tat-treated (solid bars) conditions. Cells were treated with ARF (expression plasmid cotransfected with DsRed2 and PSD95–GFP), 1 μm nutlin-3 or 100 μm l-NAME as indicated. In cells expressing PSD95ΔPEST-GFP (ΔPEST), Tat did not affect the number of synaptic sites. Data are expressed as mean ± SEM. *p < 0.01 relative to control; # p < 0.01 relative to Tat alone (untreated) (ANOVA with Bonferroni post test). C, Inhibition of an ubiquitin ligase increased and inhibition of NOS decreased, Tat-induced cell death. Cell death was measured using the PI fluorescence assay detailed in Materials and Methods. Cell death was measured after 48 h treatment with the indicated concentrations of Tat in the absence (control, circles) or presence of 1 μm nutlin-3 (open triangles) or 100 μm l-NAME (squares). PI fluorescence was normalized to that measured from cells treated for 48 h with 1 mm glutamate (100%). PI fluorescence from untreated wells was subtracted from each curve (0%). Concentration response curves were generated by fitting a logistic equation to the data using a nonlinear, least-squares curve fitting program (Origin 6.0) and EC50 values calculated. A logistic equation of the form Δ PI Fluorescence = [(A2 − A1)/(1 + (X/EC50)p)]+A1 where X = Tat concentration, A1 = percentage change in PI fluorescence without Tat, A2 = percentage change in PI fluorescence at maximal Tat concentration and p = slope factor. A set of triplicate wells from a single plating of cells was defined as a single experiment (n = 1). All data are presented as mean ± SEM.