
Figure 4.
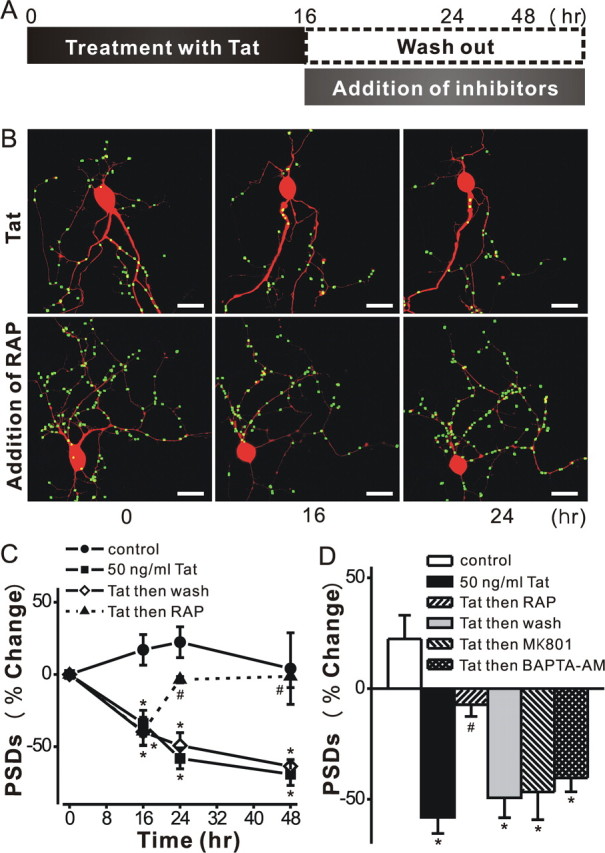
Tat-induced PSD loss is reversible. A, Schematic shows time line for experiments. B, Representative images display labeled PSDs on neurons expressing PSD95–GFP and DsRed2 before (0 h) and during (16 and 24 h) treatment with 50 ng/ml Tat. The LRP inhibitor RAP (50 nm) was added after 16 h (bottom frames). Note that PSDs lost after 16 h exposure to Tat recovered following treatment with RAP. C, Graph shows significant PSD loss after 16 h exposure to Tat which was sustained for 48 h in the continued presence of Tat (squares) or if Tat was removed after 16 h (open diamonds). PSDs recovered to control (circles) levels following addition of RAP at 16 h (triangles). Data are expressed as mean ± SEM *p < 0.01 relative to control; # p < 0.001 relative to Tat alone for 16 h (ANOVA with Bonferroni post test). D, Bar graph summarizes the net changes in the number of PSD95–GFP puncta (PSDs) 24 h after no treatment (control, open bar) or the addition of Tat (solid bars). The indicated treatments were applied after 16 h exposure to Tat and changes were measure 8 h later (24 h elapsed time). Data are expressed as mean ± SEM. *p < 0.01 relative to control; # p < 0.05 relative to Tat alone for 24 h (ANOVA with Bonferroni post test).