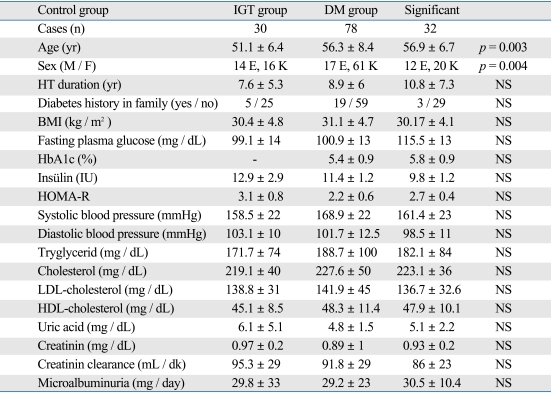
Table 2.
Features and Comparison of the Mean Values of the Control, IGT and DM Groups
IGT, impaired glucose tolerance; DM, diabetes mellitus; HT, hypertension; BMI, body mass index; AbAlc, hemoglobin A1c; HOMA-R, homeostasis model assessment index ratio; LDL, low density lipoprotein; HDL, high density lipoprotein.

