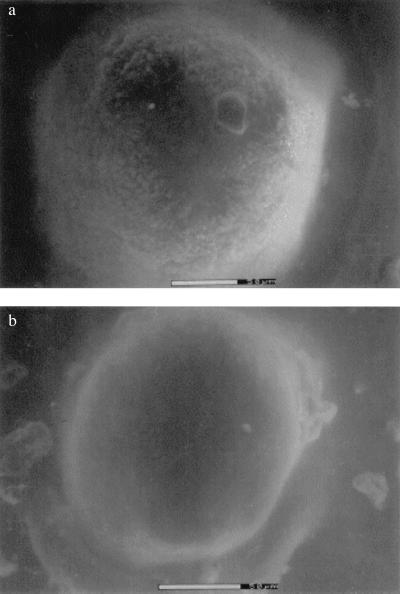
Figure 8.
(a) ESEM of an agarose-immobilized heparinase bead after a regional heparinization study in the VFPR. The surface of the bead is covered with what may be a proteinaceous material. (b) ESEM of a control agarose-immobilized heparinase bead that was exposed to saline. (The bar represents 50 μm.)

