Figure 5.

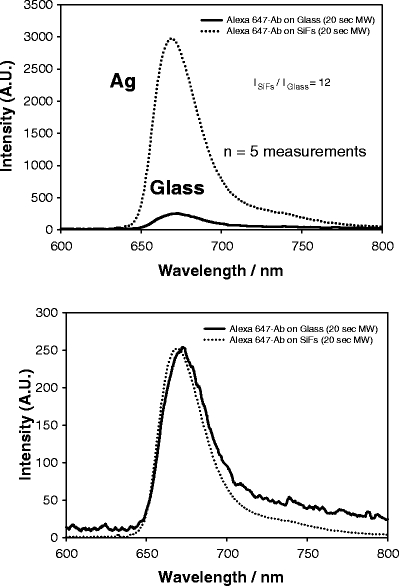
Emission spectrum of Alexa 647 on both SiFs and glass after 20-s low-power microwave heating (top) and normalized to the fluorescence emission on glass (bottom). The spectra are the mean of five measurements on the respective surfaces.

Emission spectrum of Alexa 647 on both SiFs and glass after 20-s low-power microwave heating (top) and normalized to the fluorescence emission on glass (bottom). The spectra are the mean of five measurements on the respective surfaces.