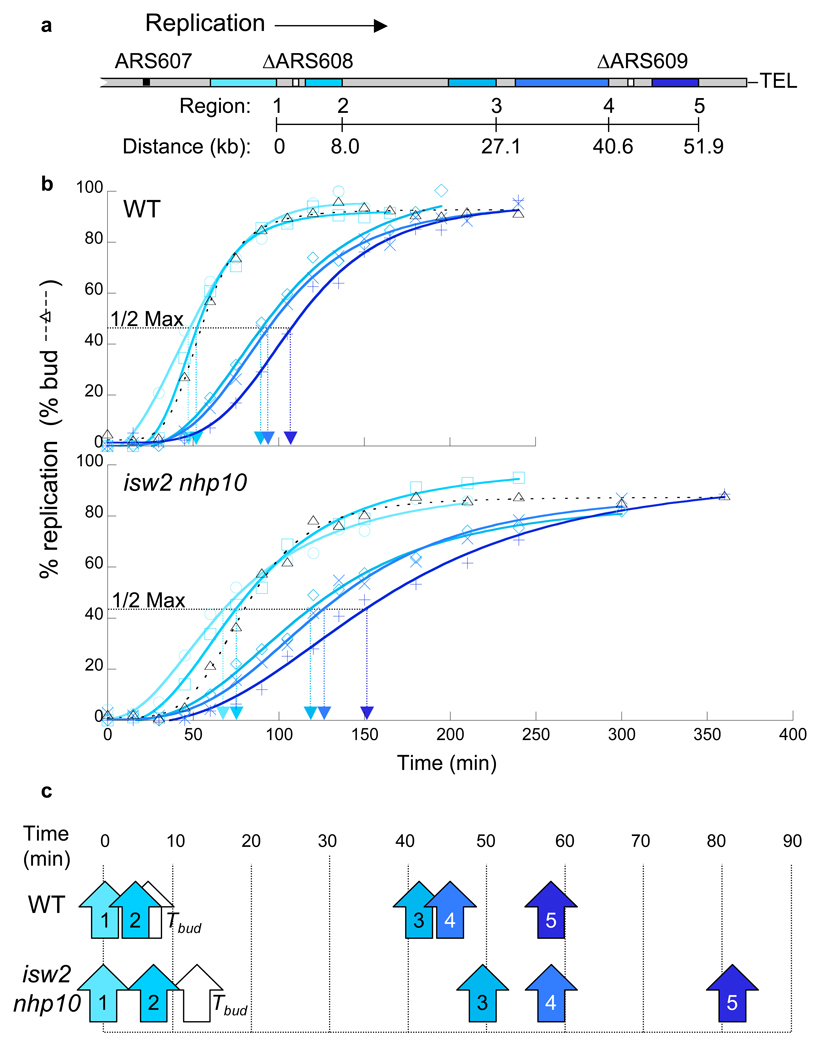
Figure 3.
Replication-fork progression is slowed in isw2 nhp10 mutants. (a) Diagram of the right arm of chromosome VI in the strains used for replication-fork progression measurements. The locations of the five regions (Regions 1–5) monitored for replication are shown in shades of blue. ARS608 and ARS609 (white boxes) are deleted to promote unidirectional replication from ARS607 to the telomere25. (b) Replication kinetics along chromosome VI. Percent replication of Regions 1–5 (colors correspond to diagram in a) was determined throughout S phase in the presence of MMS. The dashed line corresponds to the percentage of budded cells. The horizontal dotted line corresponds to the percent replication value one-half of the maximum obtained for that experiment. The Trep for that region is indicated on the x-axis by the arrowhead of the same color. Wild type (YTT3528) and isw2 nhp10 (YTT3531) strains were treated as in Supplementary Figure 2a. The kinetic curves of replication in the double mutant are more flat than those of wild type cells because the mutant is released from G1 arrest in a less synchronous fashion (see the budding index and Supplementary Fig. 4b). Importantly, the difference in the release kinetics only affects the slope of kinetic curve at each time point, not the distance between each line that reflects replication fork rate. (c) Replication times relative to Region 1. The values for Trep determined in (b) were plotted relative to the value for Region 1 and are indicated by arrows (colors correspond to diagram in a). The white arrows indicate the time of half-maximal budding in the population (Tbud).

