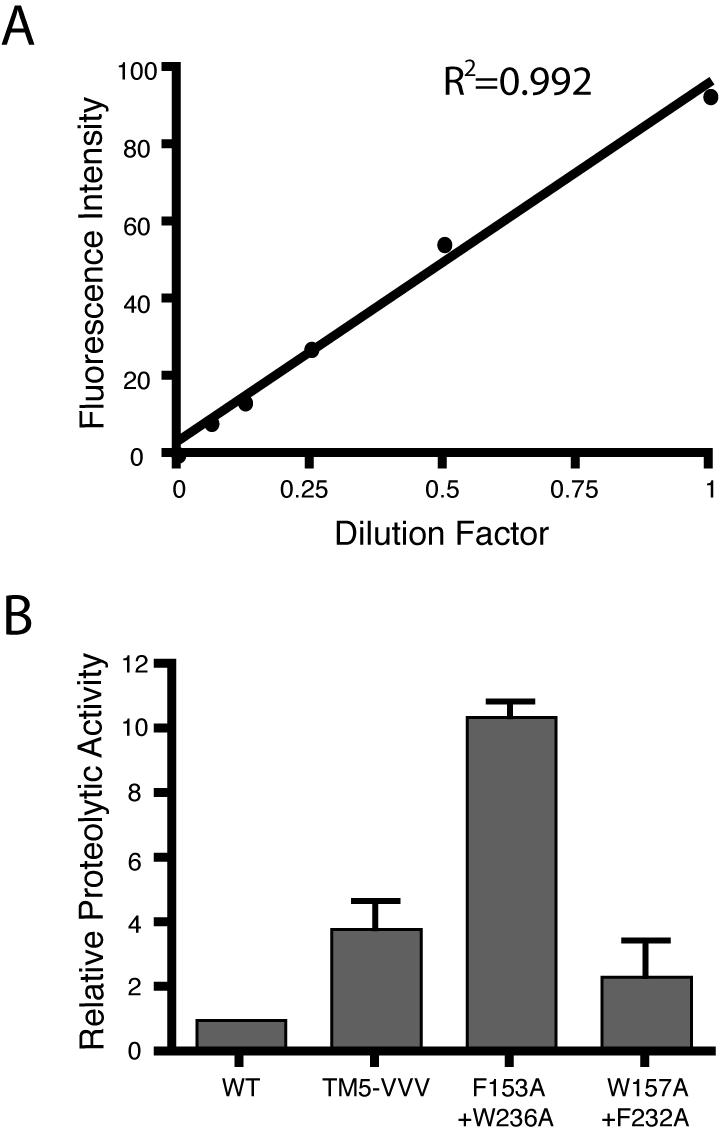
Figure 3. Quantification of transmembrane segment 5 mutant GlpG activity.

A. Cleaved Spitz was quantified using infrared fluorescence western analysis. Standard curve of 2-fold dilutions of the F153A+W236A signal from 1 (undiluted) to a 1/16 dilution revealed linearity in detection with an R2 value of 0.992. Note that this range represented the highest signal detected in the samples (undiluted) to 16-fold below the signal, which was below the lowest analyzed sample signal. B. The relative activity of L229V+F232V+W236V (VVV), F153A+W236A, and W157A+F232A were quantified relative to wildtype activity, which was arbitrarily set to 1. The error bars show standard deviation.
