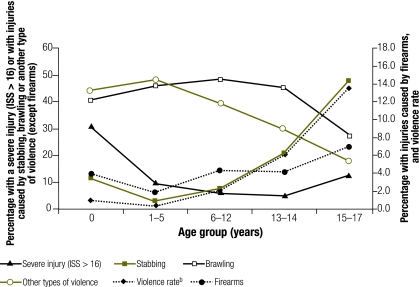
Fig. 3.
Variation in the percentage of violence-related injuries attributable to specific types of violence and in the percentage of injuries classified as severe across different age groups of children, Israel, 1998–2006a
ISS, Injury Severity Score
a The data were obtained from the Israeli National Trauma Registry.
b Percentage of all injuries that were violence-related, in each age group.

