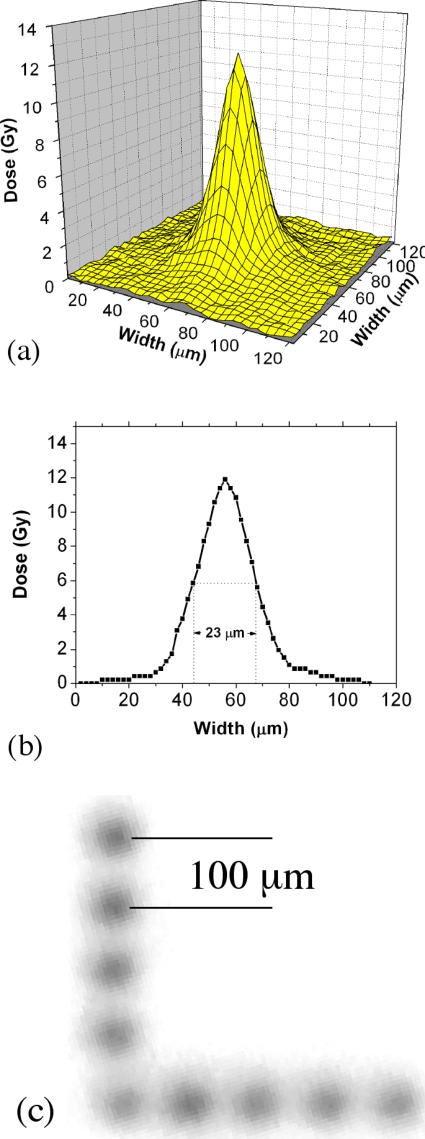
Figure 3.
(a) 3D plot of dose as measured from scan of an electron irradiated radiochromic film. (b) Data cross section of a 3D plot. The peak exposure is 12 Gy with a FWHM of 23 μm. (c) Successive exposures in the radiochromic film were made following 100 μm movement via the simple translation stage to form the L shape seen above.

