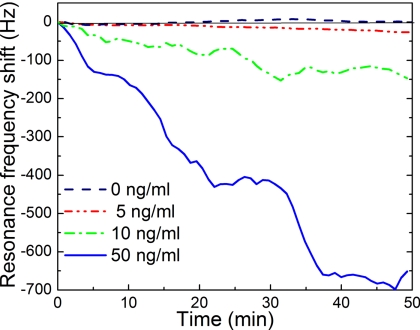
Figure 3.
Resonance frequency shift vs time of PEMS-B at 5, 10, and 50 ng∕ml of Her2 in a background of 1 mg∕ml BSA. All results were the average of two independent detections with frequency shifts of 675±160, 150±36, and 40±6 Hz at t=50 min, for 50, 10, and 5 ng∕ml Her2 concentrations, respectively. The control experiment at 0 ng∕ml of Her2 (dashed line) was obtained with a surrogate PMN-PT PEMS similar to PEMS-B. As can be seen, the surrogate PEMS 0±5 Hz at t=50 min at 0 ng∕ml of Her2.

