Figure 8.
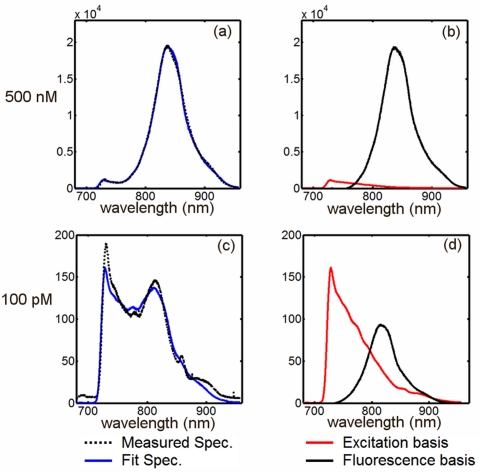
A spectral fitting routine is used to decouple fluorescence spectra from the measured signal. The spectral fitting algorithm determines the relative contribution of the basis spectra [right column, (b) and (d)] which best fits the measured spectrum. Two examples are presented above, both for a 70 mm diameter homogeneous phantom containing intralipid, ink, and ICG [500 nM for graphs (a) and (b) and 100 pM for graphs (c) and (d)].

