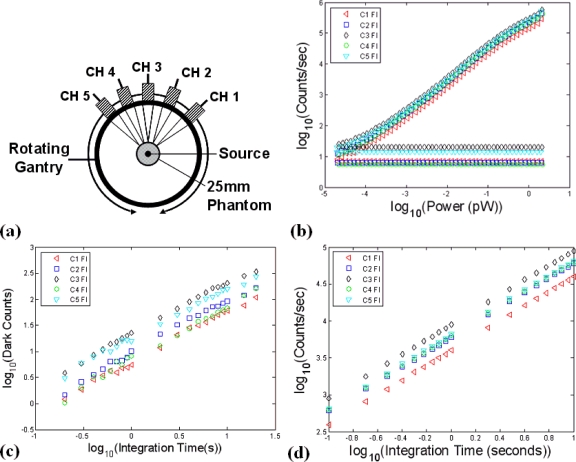
Figure 5.
In (a), the setup used to assess PMT linearity is shown. By using a collimated source and injecting it orthogonally into the center of a 25 mm cylindrical phantom, a diffuse uniform source is obtained and the same optical power was sampled by all channels simultaneously, allowing the relative sensitivities to be examined. PMT linearity over the entire dynamic range was also examined by examining the count rate as a function of input optical power (b). Plots of the dark count rate as a function of integration time are shown in (c) and the PMT time linearity response is shown in (d).

