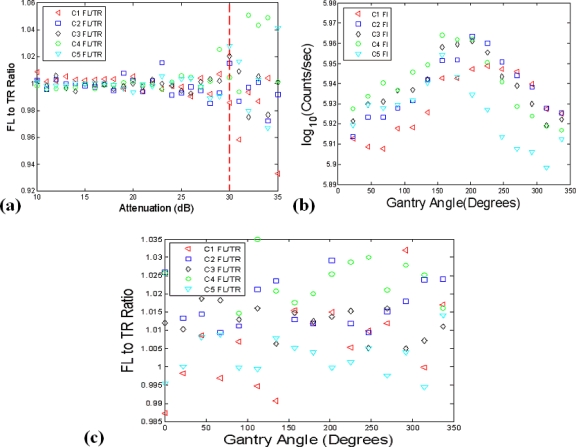
Figure 7.
In (a), the data calibration process was analyzed by taking the Fl-to-Tr ratio measurements of the calibrated relative intensity data. Using the experimental setup depicted in Fig. 5a, a Fl-to-Tr ratio of one can be expected for well calibrated data. The validity of absolute intensity data values were also examined in (b) and determined to be problematic, based on an observed 11% standard deviation in the data that should be calibrated to the same value. The Fl-to-Tr data type appeared more resistant to errors from possible misalignment of the stage with respect to the gantry’s center of rotation, as shown in (c).

