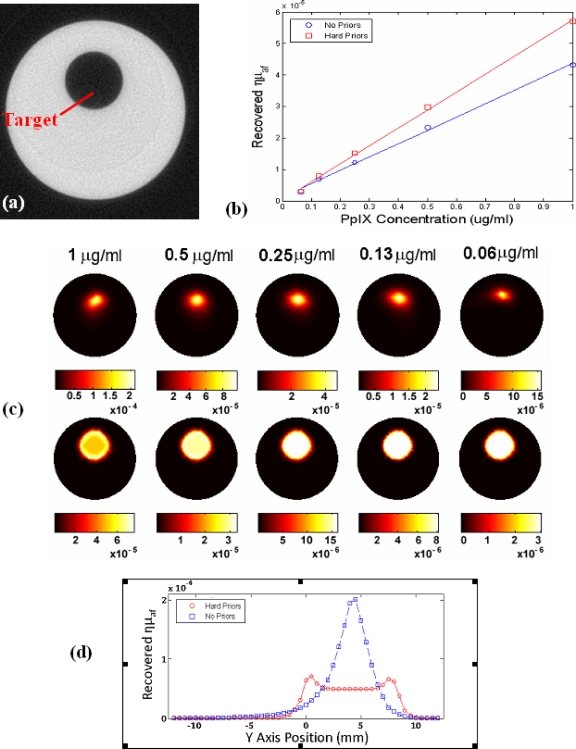
Figure 9.
A cross sectional μCT image of the 25 mm diameter resin phantom is shown in (a). System linearity was examined by filling the target region with a range of protoporphyrin IX concentrations with Intralipid to match the phantom. The recovered Fl yield values (ημaf), from tomography were as shown in (b). The corresponding images are shown without prior information (top) and with (bottom) priors in (c). In (d) a profile plot is shown for the reconstruction of the highest concentration, showing the cross section vertically through the inhomogeneity, for the two cases of with and without prior information in the reconstruction.

