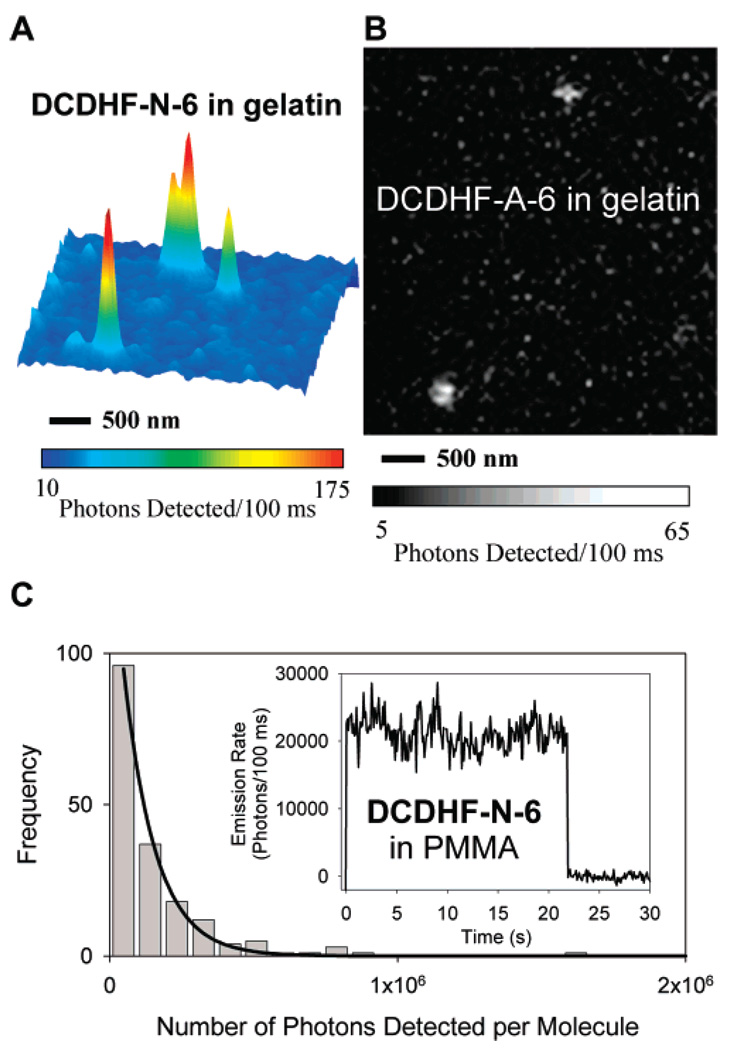
Figure 4.
(A) Surface plot of emission from single DCDHF-N-6 molecules in a gelatin film, with 2 × 2 Gaussian smoothing. For this epifluorescence image, the excitation wavelength was 532 nm, the intensity at the sample was approximately 0.25 kW/cm2, and the integration time was 100 ms per frame. Pixel intensities in images were corrected for the dark offset count rate of the camera, then converted to photons detected. (B) Single DCDHF-A-6 molecules imaged in a gelatin film; the excitation wavelength was 594 nm, the intensity at the sample was approximately 0.45 kW/cm2, and the integration time was 100 ms. (C) Histogram of total photons detected from 193 different DCDHF-N-6 molecules in a PMMA film. Ntot,detected is the exponential parameter of a single-exponential fit (solid line). Inset: The spatially integrated fluorescence intensity time trace of a representative individual molecule. The reported intensity is background-subtracted and converted to photons emitted. Emission terminates at 22 s due to photobleaching. Very few molecules exhibited any blinking on the 100 ms integration time scale of the measurement, which is consistent with what has been reported for other members of the class of DCDHF fluorophores (ref 15).

