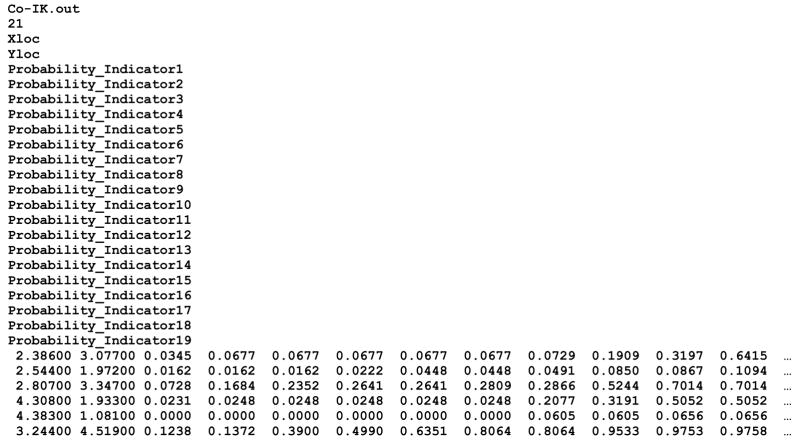
Figure 5.
Output file created by AUTO-IK.exe following the cross-validation analysis of cobalt concentrations. The text file (Geo-EAS format) includes the X and Y coordinates of each sampled location, and the estimated ccdf values for all 19 thresholds. This output file was obtained when running the code with the parameter file of Figure 2.

