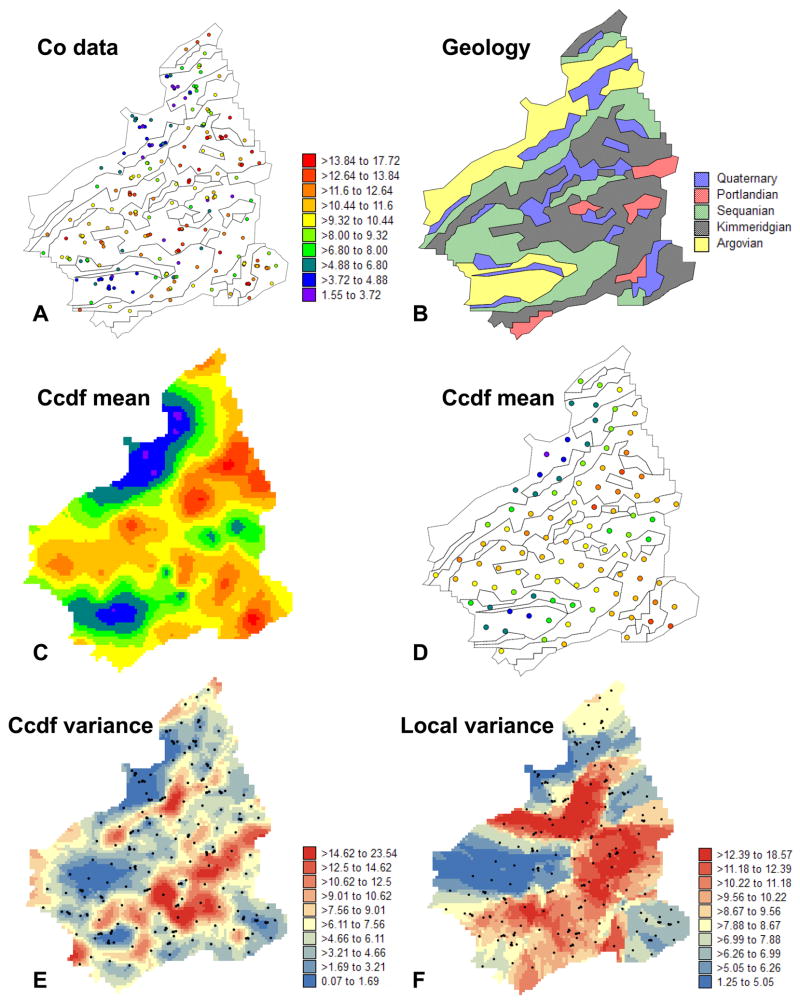
Figure 9.
(A) 259 observations available for estimating soil cobalt concentration at the nodes of a 50-m grid (C) or at 100 test locations (D) using ordinary indicator kriging. The map of the ccdf mean (C) shows lower cobalt concentrations on Argovian rocks (B). (E) The map of the ccdf variance indicates larger uncertainty where data, depicted by black dots, are scarce and/or where the local variance of the data (F) is large.

